4 Article 2
Investigating Biases Associated with Dietary Starch Incorporation and Retention with an Oral Biofilm Model
4.1 Introduction
Dental calculus has proven to contain a wealth of dietary information in the form of plant microfossils (Hardy et al., 2009; Henry & Piperno, 2008), proteins (Hendy et al., 2018; Warinner, Hendy, et al., 2014), and other organic residues (Buckley et al., 2014). This dietary information can be preserved within the mineralised dental plaque over many millennia, providing a unique window into the food-related behaviours of past populations (Henry & Piperno, 2008; Jovanović et al., 2021; Tao et al., 2020) and extinct species (Hardy et al., 2012; Henry et al., 2014).
Until recently, only a few studies directly investigated the presence of plant microremains in the dental calculus of archaeological remains. The ability to extract phytoliths from the dental calculus of archaeological fauna to investigate diet was first noted by Armitage (1975), and later by Middleton and Rovner (1994), and Fox and colleagues (1996). Starches and phytoliths were extracted from human dental calculus by Cummings and Magennis (1997).
In more recent years, the study of dental calculus has increased exponentially, and the wealth of information contained within the mineralised matrix has largely been acknowledged. The use of dental calculus spans a wide variety of archaeological research areas, such as oral microbiome characterisation (including pathogens) through the analysis of DNA and proteins (Adler et al., 2013; Warinner, Rodrigues, et al., 2014), microbotanical remains (Hardy et al., 2009; Henry & Piperno, 2008; Mickleburgh & Pagán-Jiménez, 2012), other organic residues and proteins from dietary compounds (Buckley et al., 2014; Hendy et al., 2018), and nicotine use (Eerkens et al., 2018). Especially the extraction of starch granules has become a rich source of dietary information, as starch granules have proven to preserve well within dental calculus over a variety of geographical and temporal ranges (Henry et al., 2014; Jovanović et al., 2021; Piperno & Dillehay, 2008; Tao et al., 2020).
Despite this, our knowledge of dental calculus and the incorporation pathways of the various markers is limited (Radini et al., 2017), as is our knowledge of information-loss caused by these pathways. Additionally, the methods we use to extract and analyse dental calculus, and make inferences on past diets represent another potential source of bias. Studies on both archaeological and modern individuals have explored these biases in more detail. Extraction methods were tested by Tromp and colleagues (2017), specifically regarding decalcification using HCl or EDTA. The authors found significantly more starches with the EDTA extraction method than the HCl extraction method; however, as noted by the authors, comparisons involving archaeological calculus are problematic due to variability between and within individuals. Studies conducted on modern humans (Leonard et al., 2015) and non-human primates (R. C. Power et al., 2015; Robert C. Power et al., 2021) have explored how well microremains (phytoliths and starches) extracted from dental calculus represent the actual dietary intake. These studies are justifiably limited, despite meticulous documentation and observation, due to unknown variables and uncertainty involved in this kind of in vivo research. Dental calculus is a complex oral biofilm with a multifactorial aetiology and variable formation rates both within and between individuals (Haffajee et al., 2009; Jepsen et al., 2011), contributing to the stochasticity of starch representation being observed in numerous studies. Additionally, the concentration of oral
In this exploratory study, we use an oral biofilm model to investigate the retention of starch granules within dental calculus in a controlled laboratory setting, allowing us full control over dietary input. Our main questions concern the representation of granules extracted from the calculus compared to the actual intake. How much of the original diet is incorporated into the calculus, and how much is recovered? Is there differential loss of information from specific dietary markers that affects the obtained dietary information, and how does this affect the representation of diet from extracted microremains?
We find that, despite the absence of
4.2 Materials and Methods
4.2.1 Biofilm formation
In this study we employ a multispecies oral biofilm model following a modified protocol from Sissons and colleagues (1991) and Shellis (1978). In brief, a biofilm inoculated with whole saliva was grown on a substrate suspended in artificial saliva, and fed with sugar (sucrose). After several days of growth, the biofilm was exposed to starch solutions. Mineralisation of the biofilm was aided by exposure to a calcium phosphate solution. After 25 days of growth, the mineralised biofilm was collected for further analysis. The setup comprises a polypropylene 24 deepwell PCR plate (KingFisher 97003510) with a lid containing 24 pegs, which is autoclaved at 120°C, 1 bar overpressure, for 20 mins. The individual pegs were the substrata on which the calculus grew. Using this system allowed for easy transfer of the growing biofilm between saliva, feeding solutions, and mineral solutions.
The artificial saliva (AS) is a modified version of the basal medium mucin (BMM) described by Sissons and colleagues (1991). It contains 2.5 g/l partially purified mucin from porcine stomach (Type III, Sigma M1778), 5 g/l trypticase peptone (Roth 2363.1), 10 g/l proteose peptone (Oxoid LP0085), 5 g/l yeast extract (BD 211921), 2.5 g/l KCl, 0.35 g/l NaCl, 1.8 mmol/l CaCl2, 5.2 mmol/l Na2HPO4 (Sissons et al., 1991), 6.4 mmol/l NaHCO3 (Shellis, 1978), 2.5 mg/l haemin. This is subsequently adjusted to pH 7 with NaOH pellets and stirring, autoclaved (15 min, 120°C, 1 bar overpressure), and supplemented with 5.8
Fresh whole saliva (WS) for inoculation was provided by a 31-year-old male donor with no history of caries, who abstained from oral hygiene for 24 hours. No food was consumed two hours prior to donation and no antibiotics were taken up to six months prior to donation. The saliva was filtered through a sterilised (with sodium hypochlorite, 10–15% active chlorine) nylon cloth to remove particulates. Substrata were inoculated with 1 ml/well of a two-fold dilution of WS in sterilised 20% (v/v) glycerine for four hours at 36°C, to allow attachment of the salivary pellicle and plaque-forming bacteria. After initial inoculation, the substrata were transferred to a new plate containing 1 ml/well AS and incubated in a shaking incubator (Infors HT Ecotron) at 36°C, 30 rpm. The inoculation process was repeated on days 3 and 5. AS was partially refreshed once per day and fully refreshed every three days, throughout the experiment, by transferring the substrata to a new plate containing stock AS. To feed the bacteria, the substrata were transferred to a new plate, containing 5% (w/v) sucrose, for six minutes twice daily, except on inoculation days (days 0, 3, and 5), where the samples only received one sucrose treatment after inoculation.
Starch treatments were initiated on day 9 to avoid starch granule counts being affected by
After 15 days, mineralisation was encouraged with a calcium phosphate monofluorophosphate urea (CPMU) solution containing 20 mmol/l CaCl2, 12 mmol/l NaH2PO4, 5 mmol/l Na2PO3F, 500 mmol/l urea, and (0.04 g/l MgCl) (Pearce & Sissons, 1987; Sissons et al., 1991). The substrata were submerged in 1 ml/well CPMU for six minutes, five times daily, in a two-hour cycle. During the mineralisation period, starch treatments were reduced to once per day after the five CPMU treatments. This process was repeated for 10 days until the end of the experiment on day 24 (see Figure 4.1 for an overview of the protocol).
All laboratory work was conducted in sterile conditions under a laminar flow hood to prevent starch and bacterial contamination. Control samples that only received sucrose as a treatment were included to detect starch contamination from the environment or cross-contamination from other wells in the same plate.
4.2.2 Amylase activity detection
An
4.2.3 Treatment solutions
A 1 ml aliquot of each starch solution was taken, from which 10
4.2.4 Extraction method
Extraction of starches from the calculus samples was performed by dissolving the calculus in 0.5
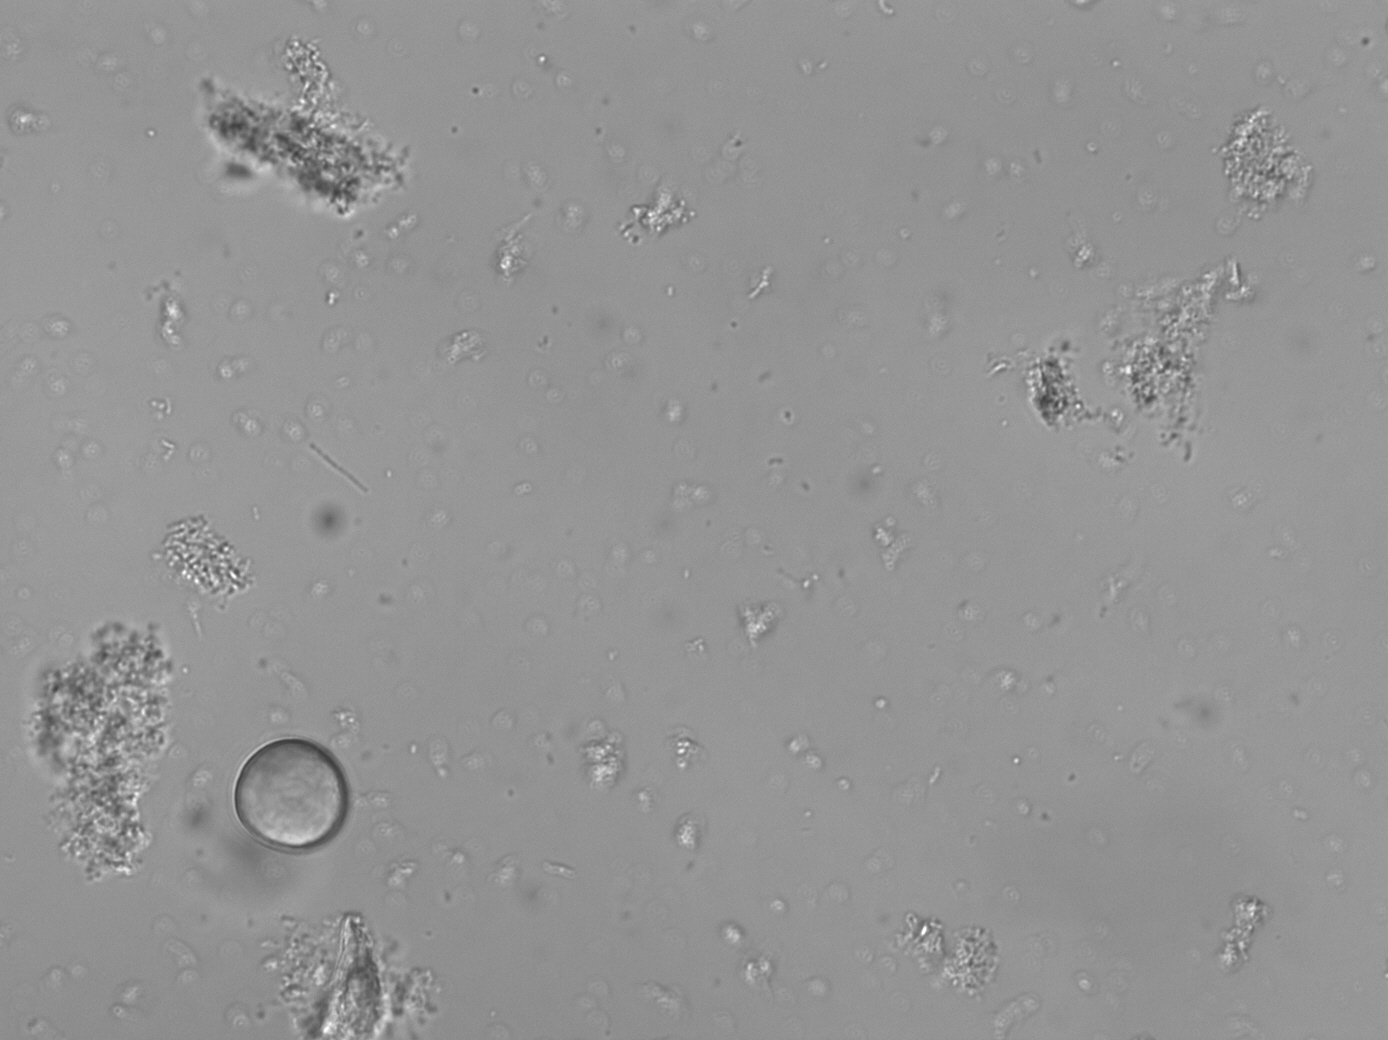
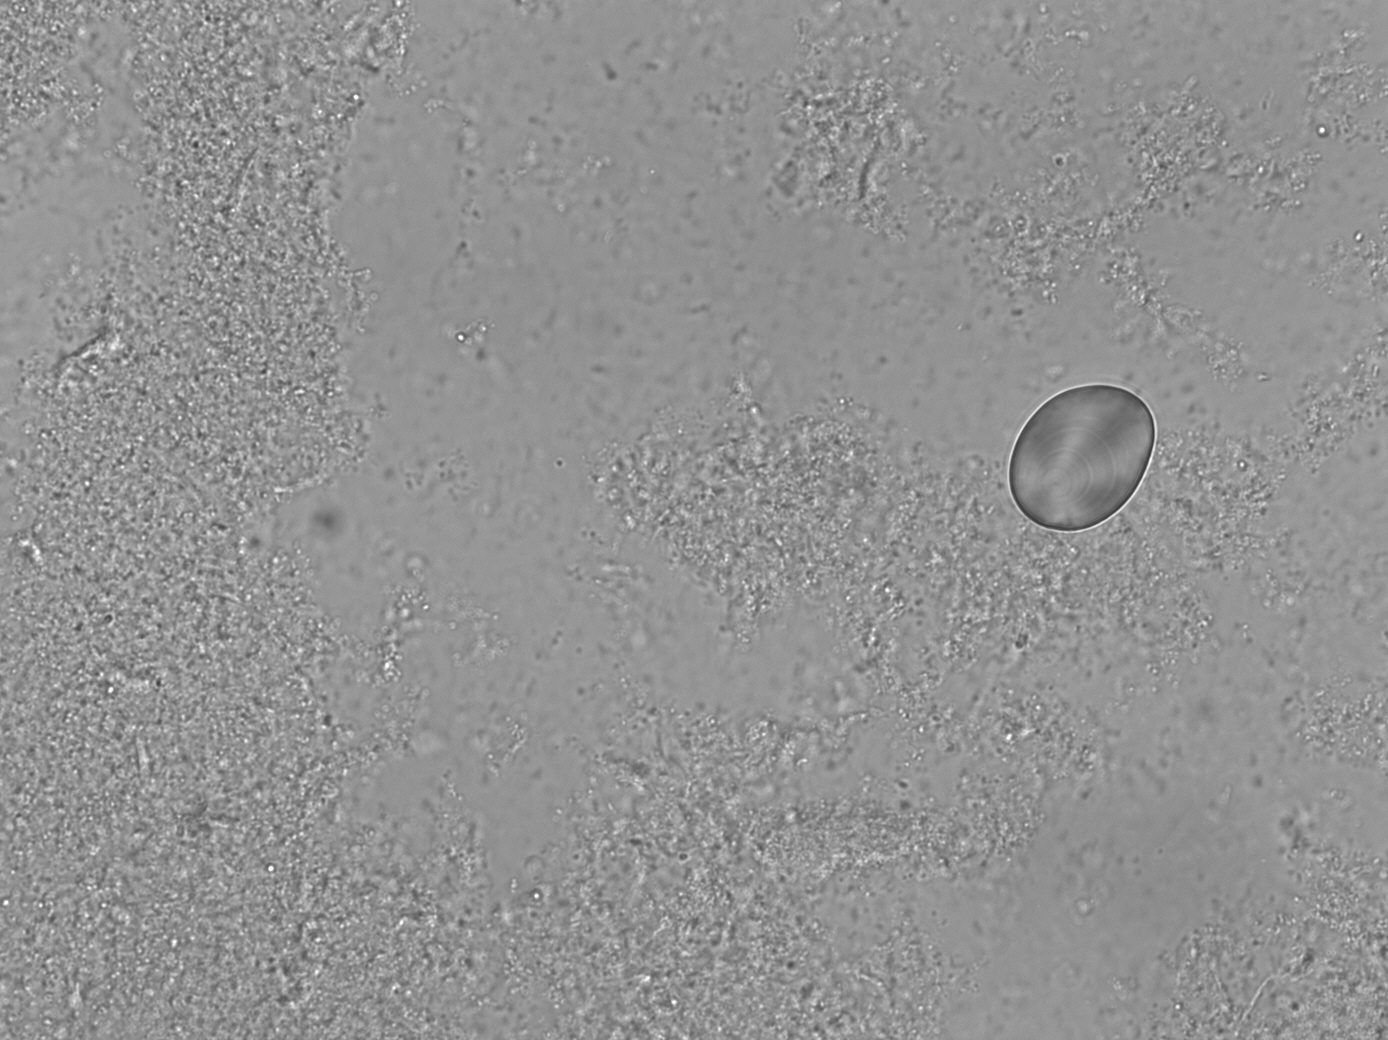
Both wheat and potato granules were divided into three size categories: small (<10
4.2.5 Statistical analysis
Statistical analysis was conducted in R version 4.3.2 (2023-10-31) (R Core Team, 2020) and the following packages: tidyverse (Wickham et al., 2019), broom (Robinson et al., 2021), here (Müller, 2020), and patchwork (Pedersen, 2020).
To see if biofilm growth was differently affected by starch treatments, a one-way ANOVA with sample weight as the dependent variable (DV) and treatment as the grouping variable (GV) was conducted. To analyse granule counts and calculate size proportions, mean counts for each treatment were taken across both experimental plates, resulting in a mean count for each granule size category within each treatment.
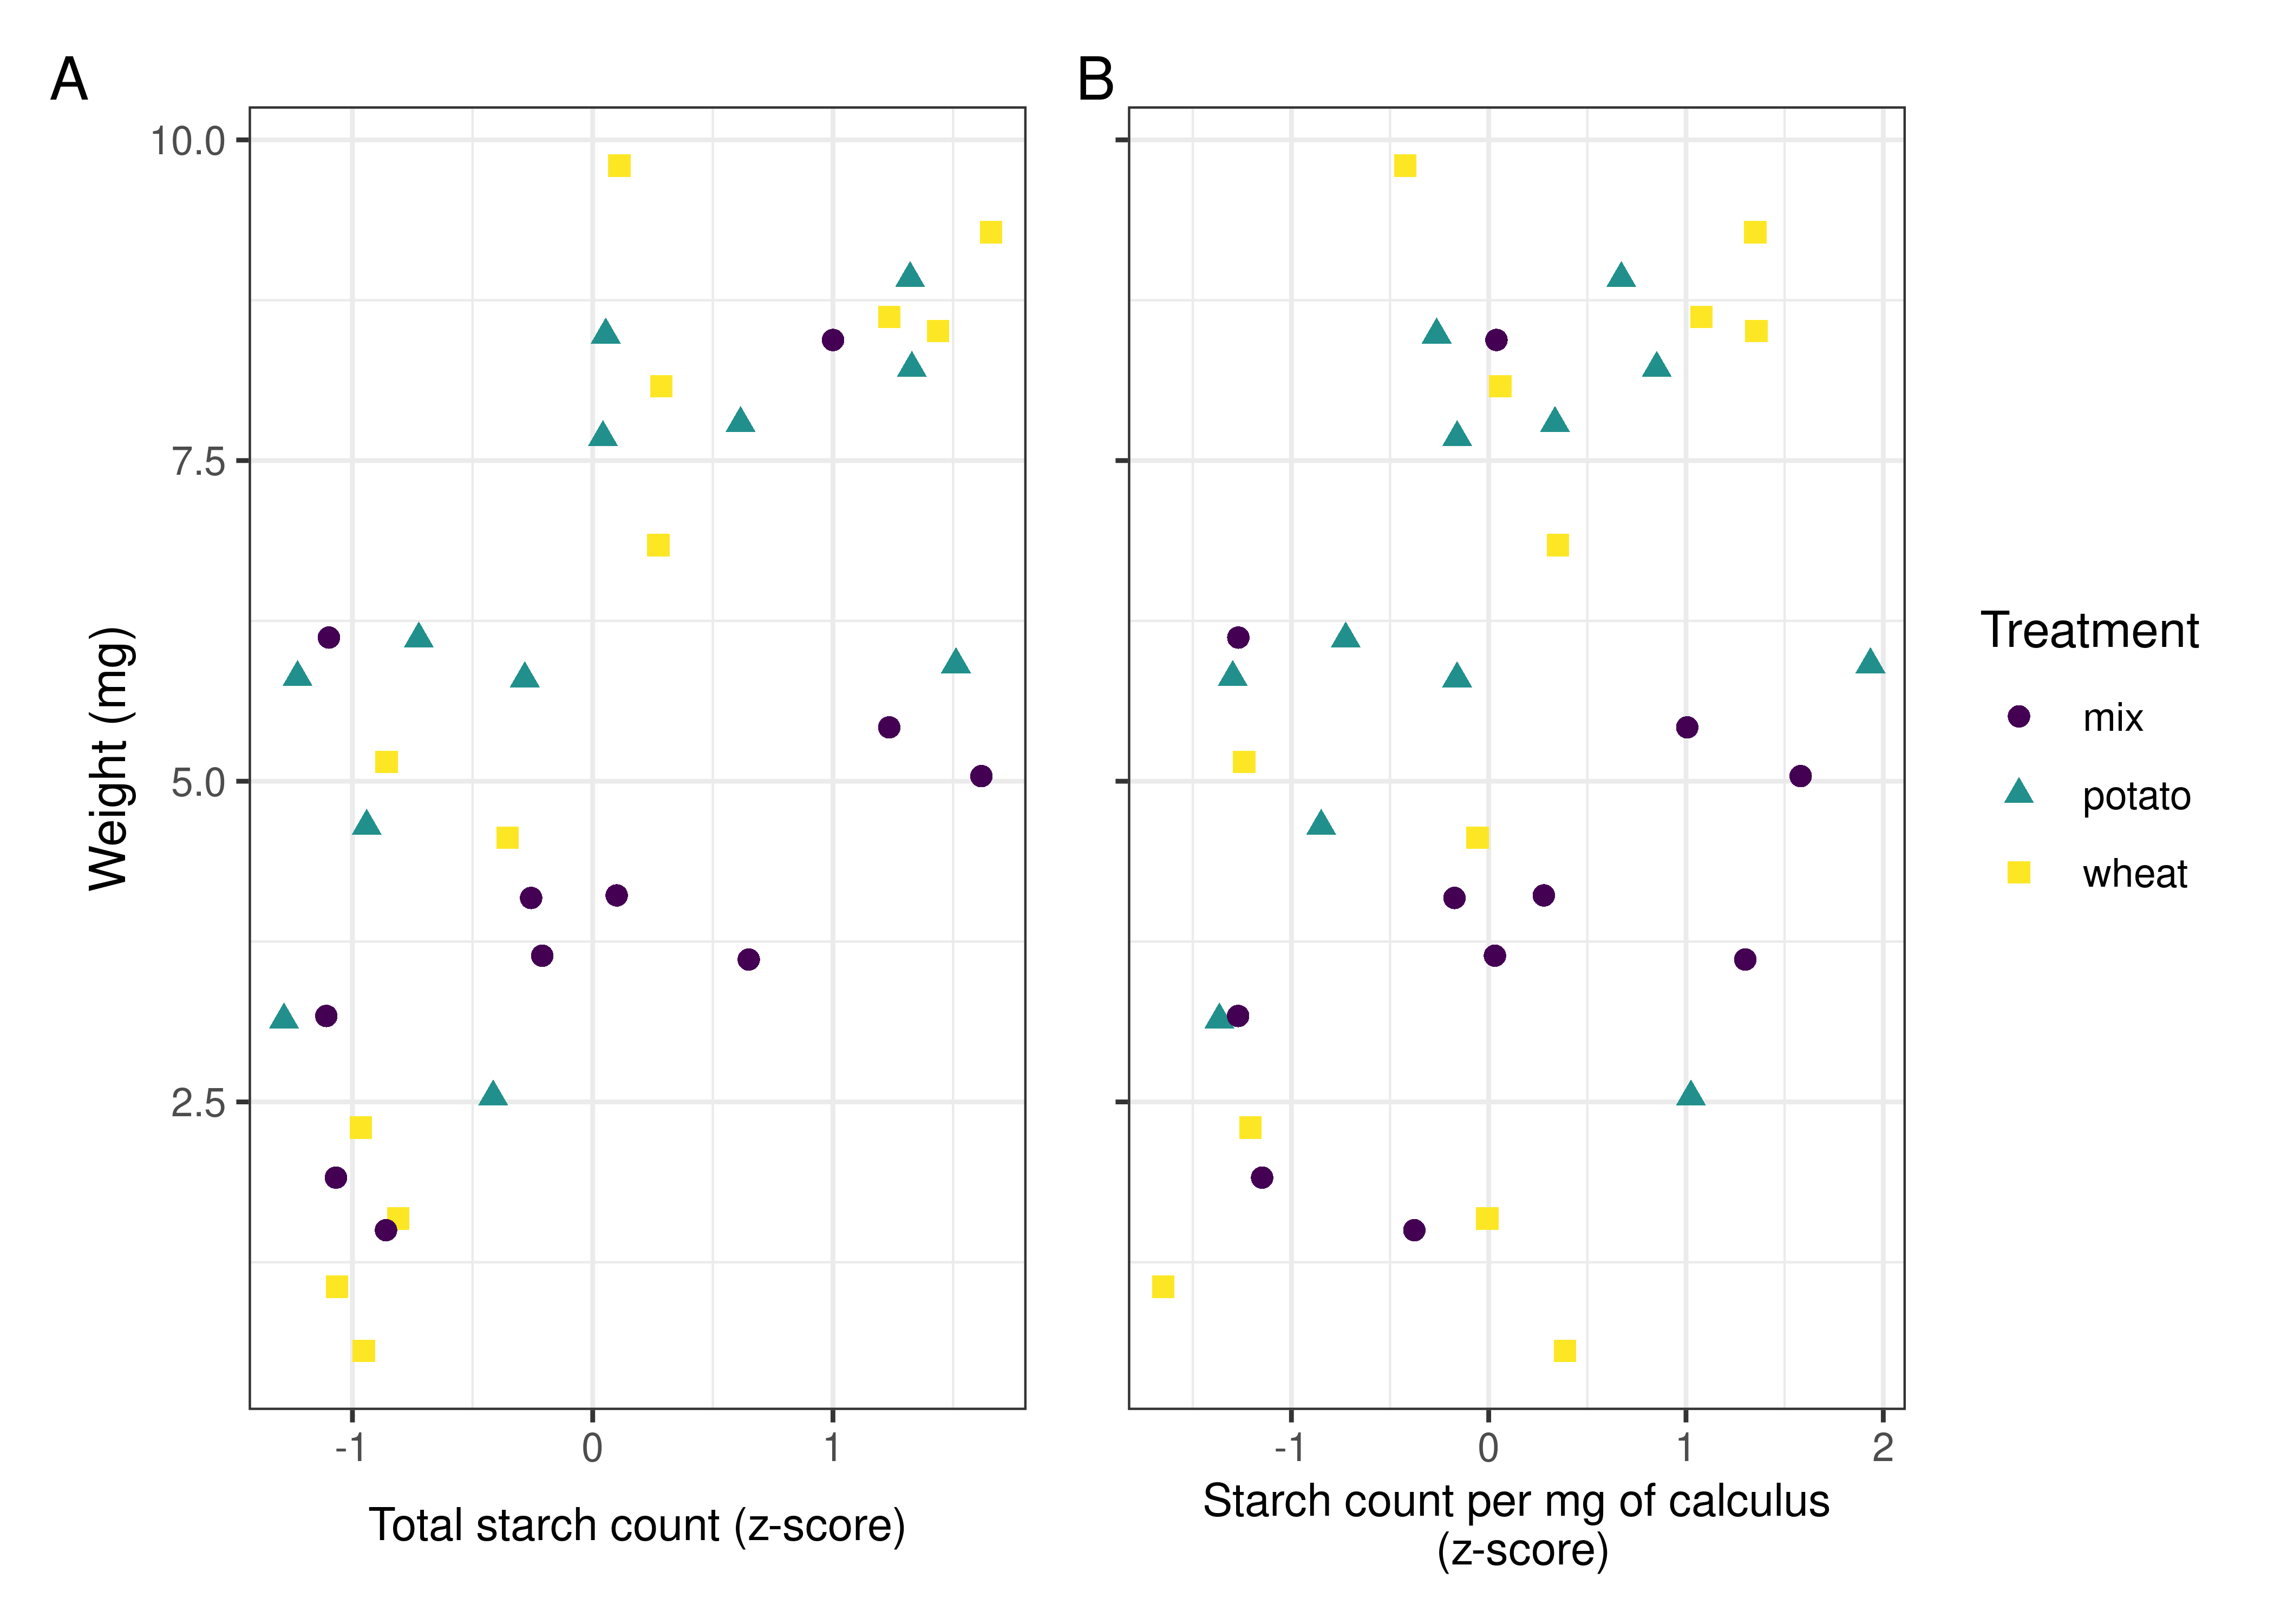
Pearson’s r was conducted on sample weight and total starch count, as well as sample weight and starch count per mg calculus. The total count for each sample within a treatment was standardised by z-score to account for the differences in magnitude between the potato and wheat counts. This was applied to total biofilm weight and starch count per mg calculus (also z-score standardised) to account for differences in starch concentration in the calculus (as per Wesolowski et al., 2010).
4.3 Results
All samples yielded sufficient biofilm growth and starch incorporation to be included in the analysis (Figure 4.2), resulting in a total of 48 biofilm samples (two plates of 24), 45 of which were used for analysis (three samples were set aside for later analysis). Most control samples contained no starch granules, while some contained negligible quantities (see Supplementary Material).


4.3.1 No amylase activity detected in the model
No
4.3.2 Treatment type had minimal effect on biofilm growth
A one-way ANOVA suggests that the type of starch used during the biofilm growth period had a minimal effect on the growth of the biofilm (expressed as total dry weight of the sample), F(3, 43) = 1.16, p = 0.335. A summary of sample weights is available in Table 4.1.
4.3.3 Starch counts
It was not possible to differentiate between potato and wheat starches smaller than ca. 10
The separate wheat and potato solutions were made with a 0.25% (w/v) starch concentration, while the mixed-starch solution was made with 0.25% (w/v) of each starch, with a total concentration of 0.50% (w/v). The mixed treatment had the highest absolute count of starch granules in solution (mean = 2.9^{7}), while the biofilms exposed to the wheat solution preserved the greatest number of granules (mean = 2.77^{4}). The potato treatment had the lowest absolute counts in both the solution (3.02^{6}) and in the biofilm samples (4850) (Table 4.2 and Table 4.3).
| Solution | Starch | Small (%) | Medium (%) | Large (%) | Total (%) |
|---|---|---|---|---|---|
| mix | potato | 1051733 (53.1%) | 928000 (46.9%) | 1979733 (100.0%) | |
| mix | wheat | 18838400 (69.7%) | 6403200 (23.7%) | 1794133 (6.6%) | 27035733 (100.0%) |
| mix | both | 18838400 (64.9%) | 7454933 (25.7%) | 2722133 (9.4%) | 29015467 (100.0%) |
| potato | potato | 123733 (4.1%) | 1337867 (44.4%) | 1554400 (51.5%) | 3016000 (100.0%) |
| wheat | wheat | 16139467 (63.5%) | 6434133 (25.3%) | 2830400 (11.1%) | 25404000 (100.0%) |
| Treatment | Starch | Small (%) | SD | Medium (%) | SD | Large (%) | SD | Total (%) | SD |
|---|---|---|---|---|---|---|---|---|---|
| mix | potato | 1959 (79.6%) | 1801 | 501 (20.40%) | 446 | 2460 (100%) | 2189 | ||
| mix | wheat | 9515 (54.60%) | 8860 | 6522 (37.4%) | 6026 | 1381 (7.93%) | 1196 | 17417 (100%) | 15878 |
| mix | both | 9515 (47.90%) | 8860 | 8480 (42.7%) | 7653 | 1882 (9.47%) | 1596 | 19877 (100%) | 17768 |
| potato | potato | 351 (7.24%) | 297 | 3565 (73.6%) | 2402 | 930 (19.20%) | 929 | 4846 (100%) | 3316 |
| wheat | wheat | 15235 (55.00%) | 11944 | 12148 (43.9%) | 11052 | 1953 (7.06%) | 2016 | 27680 (100%) | 23554 |
4.3.3.1 Proportion of available starches incorporated in samples
The proportion of total starches from the solutions that were incorporated into the samples ranged from 0.06% to 0.16%, with potato granules being more readily incorporated than wheat in both the separated- and mixed-treatment samples (Table 4.4). There is an inverse relationship between the absolute starch count in the solutions and the proportional incorporation of starches in the biofilm samples, i.e., potato had the lowest absolute count in solutions, but the highest proportional incorporation, and vice versa for the mixed treatment.
| Treatment | Starch | Small | Medium | Large | Total |
|---|---|---|---|---|---|
| mix | potato | 0.19% | 0.05% | 0.12% | |
| mix | wheat | 0.05% | 0.10% | 0.08% | 0.06% |
| mix | both | 0.05% | 0.11% | 0.07% | 0.07% |
| potato | potato | 0.28% | 0.27% | 0.06% | 0.16% |
| wheat | wheat | 0.09% | 0.19% | 0.07% | 0.12% |
Wheat incorporation was most affected in the mixed-treatment samples, with only 0.06% of the total available starches being incorporated into the sample, compared to 0.16% in the separated wheat treatment.
4.3.3.2 Size ratios differ between solutions and samples
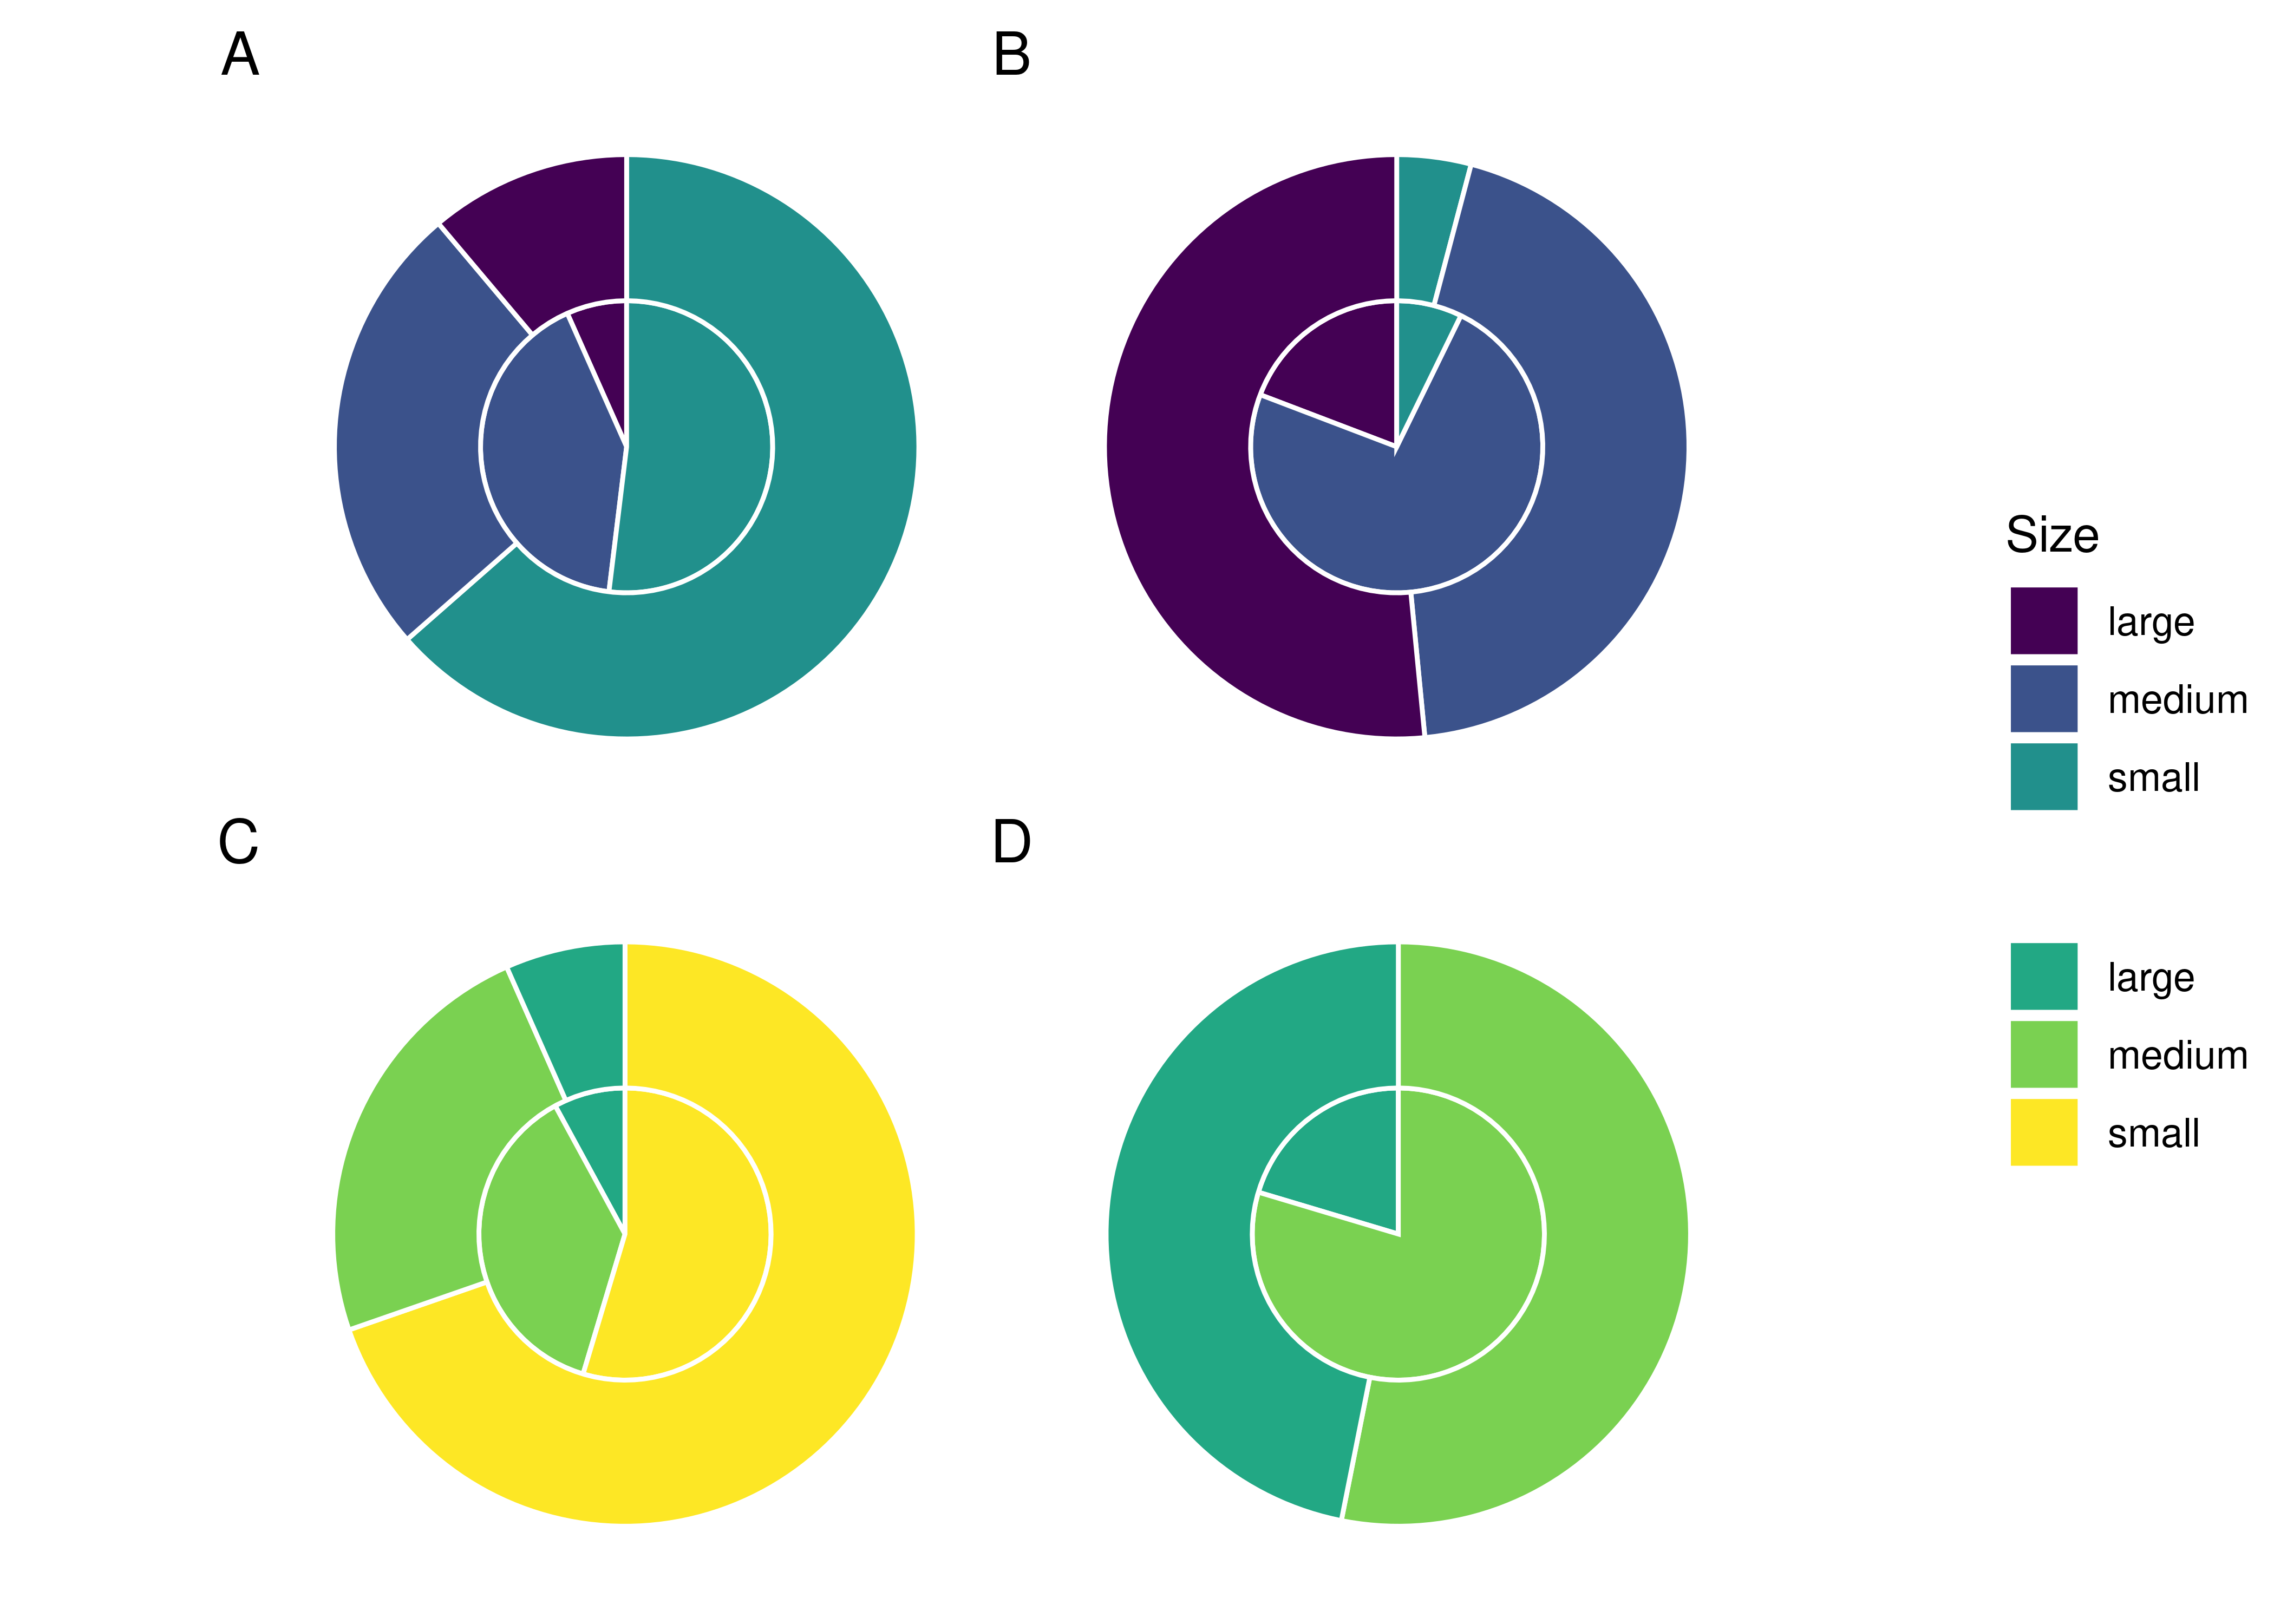
Overall, medium starch granules had a higher mean rate of incorporation (0.171%) than small (0.120%) and large (0.066%) starch granules across all treatments, while large potato starches had the lowest rate of incorporation across all treatments.
The difference in incorporation between the size categories resulted in a change in size ratios between the original starch solutions and the extracted samples. Large potato granules (> 20
4.4 Discussion
Here, we have provided a method for exploring the incorporation of dietary starches into the mineral matrix of a dental calculus biofilm model. Our results show that a very low proportion of the starches exposed to the biofilm during growth are retained in the mineral matrix, and that the size of the starch granules may affect the likelihood of incorporation. The proportions of starch granules (of all sizes) present in the extracted samples were similar across all treatments (0.06% to 0.16%), despite large differences in absolute granule counts between wheat (mean = 25,404,000) and potato (mean = 3,016,000) solutions.
The absolute counts, however, differed more visibly between treatments and was proportional with the total count of granules in the treatment solutions. Wheat and mixed solutions had the highest absolute mean count of starch granules, and also had the highest absolute mean count of starch granules extracted from the dental calculus (Table 4.2 and Table 4.3). This suggests that the starches that are more frequently consumed will be present in higher quantities in the dental calculus, at least prior to inhumation and degradation in the burial environment. Despite the low proportion of granules recovered from the model calculus (0.06% to 0.16%), the absolute counts were still substantially greater than counts recovered from archaeological remains (Tromp et al., 2017; Tromp & Dudgeon, 2015; Wesolowski et al., 2010), which could in part be due to the lack of oral amylase activity in our model. Previous research conducted on dental calculus from contemporary humans and non-human primates suggest a high level of stochasticity involved in the retention of starch granules in dental calculus, and that starch granules extracted from dental calculus are underrepresented with regard to actual starch intake, which is consistent with our findings (illustrated by high standard deviations and low proportional incorporation). Leonard and colleagues (2015) found individual calculus samples to be a poor predictor of diet in a population, as many of the consumed plants were missing from some individual samples, but were present in others.
Power and colleagues (2015) presented similar findings in non-human primates, where phytoliths were more representative of individual diets than starch granules. The size bias is also consistent with the findings by Power and colleagues (2015), who found that plants producing starches 10–20
We have also shown that the size of the starch granules influences the likelihood of incorporation into the calculus. Starch granules larger than 20
The mechanism by which starch granules are incorporated into plaque and calculus remains largely unknown, and few studies have directly investigated potential mechanisms. We know that a proportion of the starch granules entering the mouth can become trapped in the plaque/calculus, and can be recovered from archaeological samples of considerable age (Buckley et al., 2014; Henry et al., 2014; Wu et al., 2021). Studies have also shown that not all starch granules come from a dietary source. Other pathways include cross-contamination from plant interactions in soil, such as palm phytoliths adhering to the skin of sweet potatoes (Tromp & Dudgeon, 2015), or accidental ingestion not related to food consumption (Radini et al., 2017, 2019).
When starch granules enter the mouth, whether through ingestion of food or accidental intake, they immediately encounter multiple obstacles. It is likely that the bulk of starch granules are swallowed along with the food, and are only briefly present in the oral cavity. Other granules that are broken off during mastication may be retained in the dentition through attachment to tooth surfaces (including plaque and dental calculus) and mucous membranes (Dodds & Edgar, 1988; S. Kashket et al., 1991). Bacteria also have the ability to adhere to starch granules (Topping et al., 2003), which would allow starches to attach to bacterial communities within the biofilm. These granules are then susceptible to mechanical removal by the tongue, salivary clearance, and hydrolysis by
The absence of
Finally, we only used native starches in the experimental procedure and the results will likely differ for processed starches (García-Granero, 2020). Based on the comparatively low counts obtained by Leonard and colleagues (2015, Supplement 2), processing and amylase may have a substantial effect on starch granule retention in the oral cavity.
While we are unable to sufficiently address the mechanism(s) of starch incorporation with the data obtained in this study, the dental calculus model presented here is uniquely suited to explore these questions and may improve interpretations of dietary practices in past populations. Further analyses using this model can address the call for more baseline testing of biases associated with dietary research conducted on dental calculus (Le Moyne & Crowther, 2021). Our high-throughput experimental setup allows us a higher degree of control over the factors that influence starch incorporation and retention, such as dietary intake, differential survivability of starches, and inter- and intra-individual variation in plaque accumulation and mineralisation. The latter is especially difficult to control in vivo as it is influenced by numerous factors including genetics, diet, salivary flow, and tooth position and morphology (Fagernäs et al., 2021; Haffajee et al., 2009; Jepsen et al., 2011; Proctor et al., 2018; Simón-Soro et al., 2013), as well as evolutionary differences (Fellows Yates et al., 2021). The set of limitations for our model differ from in vivo methods and, as such, we expect our model to complement the results and interpretations of existing and new in vivo studies. It can also facilitate training of students and researchers on methods of dental calculus analysis, such as starch and phytolith extraction and identification, where it can replace the use of finite archaeological resources.
4.5 Conclusion
This preliminary study shows that a very small proportion of the input starch granules are retained in a dental calculus model. This and previous studies have shown that calculus has a low capacity for retention of starch granules, an effect that is compounded by diagenetic effects in archaeological remains, resulting in low overall counts of extracted granules. The proportion of starches consumed will in many cases be reflected in the quantity of starches extracted from the dental calculus—i.e., the more starch granules entering the oral cavity, the more will be recovered from extraction—at least in modern calculus samples unaffected by diagenesis and hydrolysis. Whether or not this also applies to archaeological samples remains to be tested. Additionally, we have shown that the size of granules will influence the likelihood of incorporation, as large (>20
While we have shown multiple factors that influence the likelihood of incorporation, the process still appears to be somewhat stochastic. Further research is needed to make sense of the contributing factors, and to explore the mechanisms of intra-oral starch incorporation and retention in dental calculus. The oral biofilm model described in this study provides a method to explore the incorporation and extraction of dietary compounds from dental calculus in a controlled laboratory setting. We do not expect our model to replace in vivo methods; instead, it can provide a complementary means to address the limitations of in vivo studies, and unearth the potential biases associated with dietary research conducted on archaeological dental calculus.


